
Analysis
How Predictable Is Each Sport?
Some sports reward being the better team. Some are a coin flip in a nice uniform. We put a number on the difference, and the gap is wider than you would guess.
The Story of the Line
Every fan has felt it, even the ones who would never admit to watching a betting line. Some nights the better team just wins, the way the preview said it would, and the game confirms what you already knew. Other nights the whole thing comes apart, a backup goalie stands on his head or a journeyman throws the game of his life, and a result that had no business happening happens anyway. The feeling that some sports are orderly and some are chaos is not a mood. It is a number, it is measurable, and the gap between the top of the list and the bottom is much wider than most people would guess.
The yardstick
We are going to measure predictability the plainest way there is: how often does the favorite win?
The favorite is not our opinion, and that is the whole point. It is the betting market's, distilled from everyone with money at stake and sharpened right up to the opening pitch or the first whistle. When we say the favorite won 58 percent of the time, we mean the side the market priced as more likely went on to win 58 games out of 100. The higher that number climbs, the more the sport rewards simply being better. The closer it sits to 50, the more the sport is telling you to sit down and stop pretending you know, because anything can happen and, in some sports, anything routinely does.
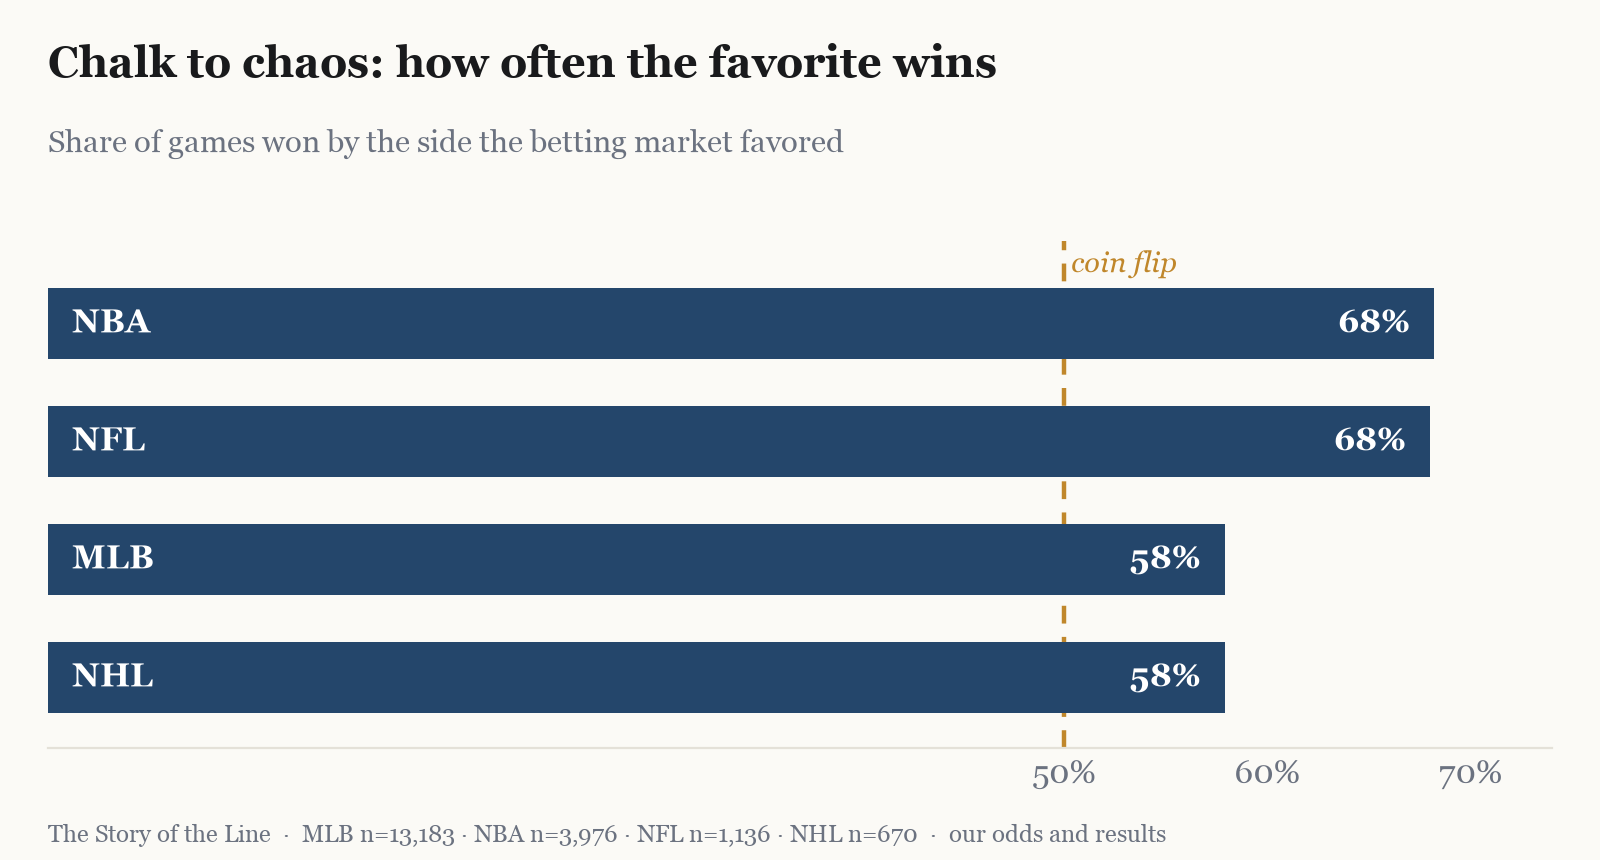
The chart splits into two clean tiers with almost nothing in the middle. At the top sit basketball and football. In the NBA the favorite wins 68 percent of the time, and the NFL lands in a dead heat with it, 68 percent across four seasons, the better team announcing itself two nights in three. Then the floor drops out. In baseball, across more than thirteen thousand games in our set, the favorite wins 57.9 percent of the time, and in hockey it is the same number to the decimal, 57.9 percent. In the two sports America treats as summer pastime and winter religion, the team the entire market agreed was better loses nearly four times in ten. Not once in a while. Four in ten, all season, every season.
The harder question
Favorite-win-rate is the intuitive measure, but it hides something, because it only asks who, not how sure. A better exam is this: when a forecaster says 70 percent, does the thing happen 70 percent of the time, and across all its games, how close does it land to what actually occurred? The tool for that is the Brier score, which is just the average squared miss between the forecast and reality. A know-nothing who says 50/50 on every game scores 0.2500. A perfect oracle scores zero. Everything real lands in between, and where it lands tells you how much there was to know in the first place.
Here is the humbling part, and it is worth sitting with. The sharpest baseball forecast that exists, the closing market, the collected wisdom of every book and model and sharp on earth, scores 0.2405. A coin flip scores 0.2500. All of that machinery, applied to a full season, moves the needle less than one point off random. Baseball is not badly forecast. Baseball is barely forecastable. The market is not wrong, the sport is just built that way.
To compare sports fairly we can restate each Brier score as how far it beats the know-nothing baseline, a skill score, and now everything lines up on one axis, even soccer with its three-way results and its draws.
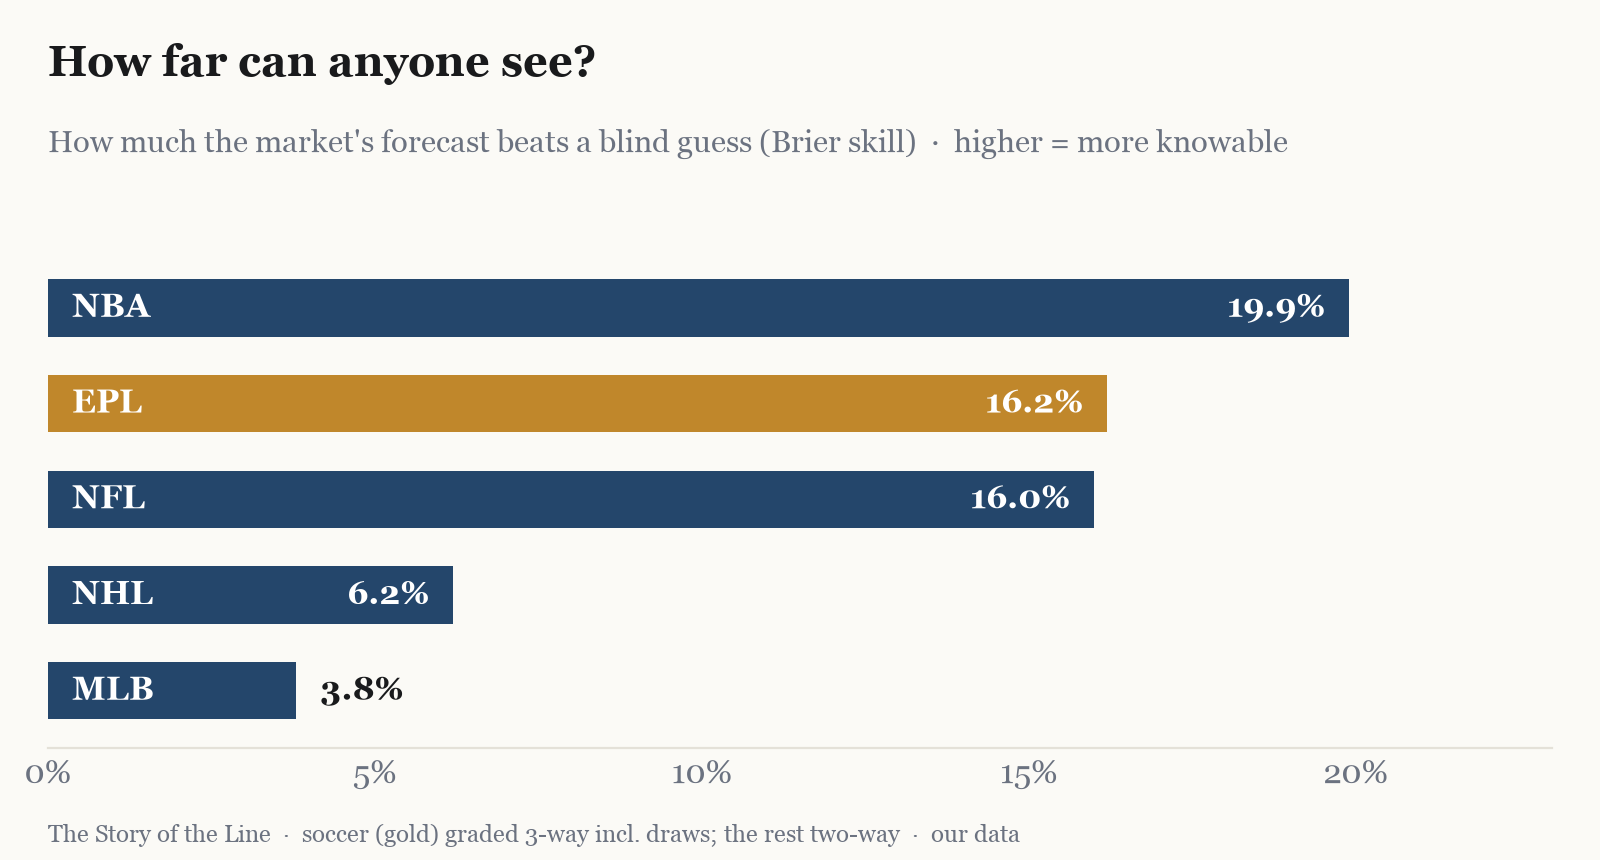
And this is where the story turns, because the order is not the one the first chart led you to expect. Basketball still leads, the market seeing about 20 percent further than a blind guess, and football sits close behind at 16 percent, right where the favorite-win chart put it. But look who crashes their party: soccer, the sport that feels like pure chaos, the one that hands you a nil-nil draw and a red card and a result nobody can explain, ties football at 16 percent. Hockey manages six. And baseball, dead last, scrapes under four. The sport that feels random every time a favorite loses is not the least predictable one. Baseball is.
The soccer result is the one worth pausing on, so let me say plainly what is happening. Soccer's favorites win outright less than half the time, which is why it feels so unruly, but a huge share of that is the draw, and the market is very good at telling you when a match is likely to be tight. The uncertainty in soccer lives in which of three outcomes, and the market prices that distribution well. Baseball's uncertainty lives somewhere no model can reach.
Is the line honest?
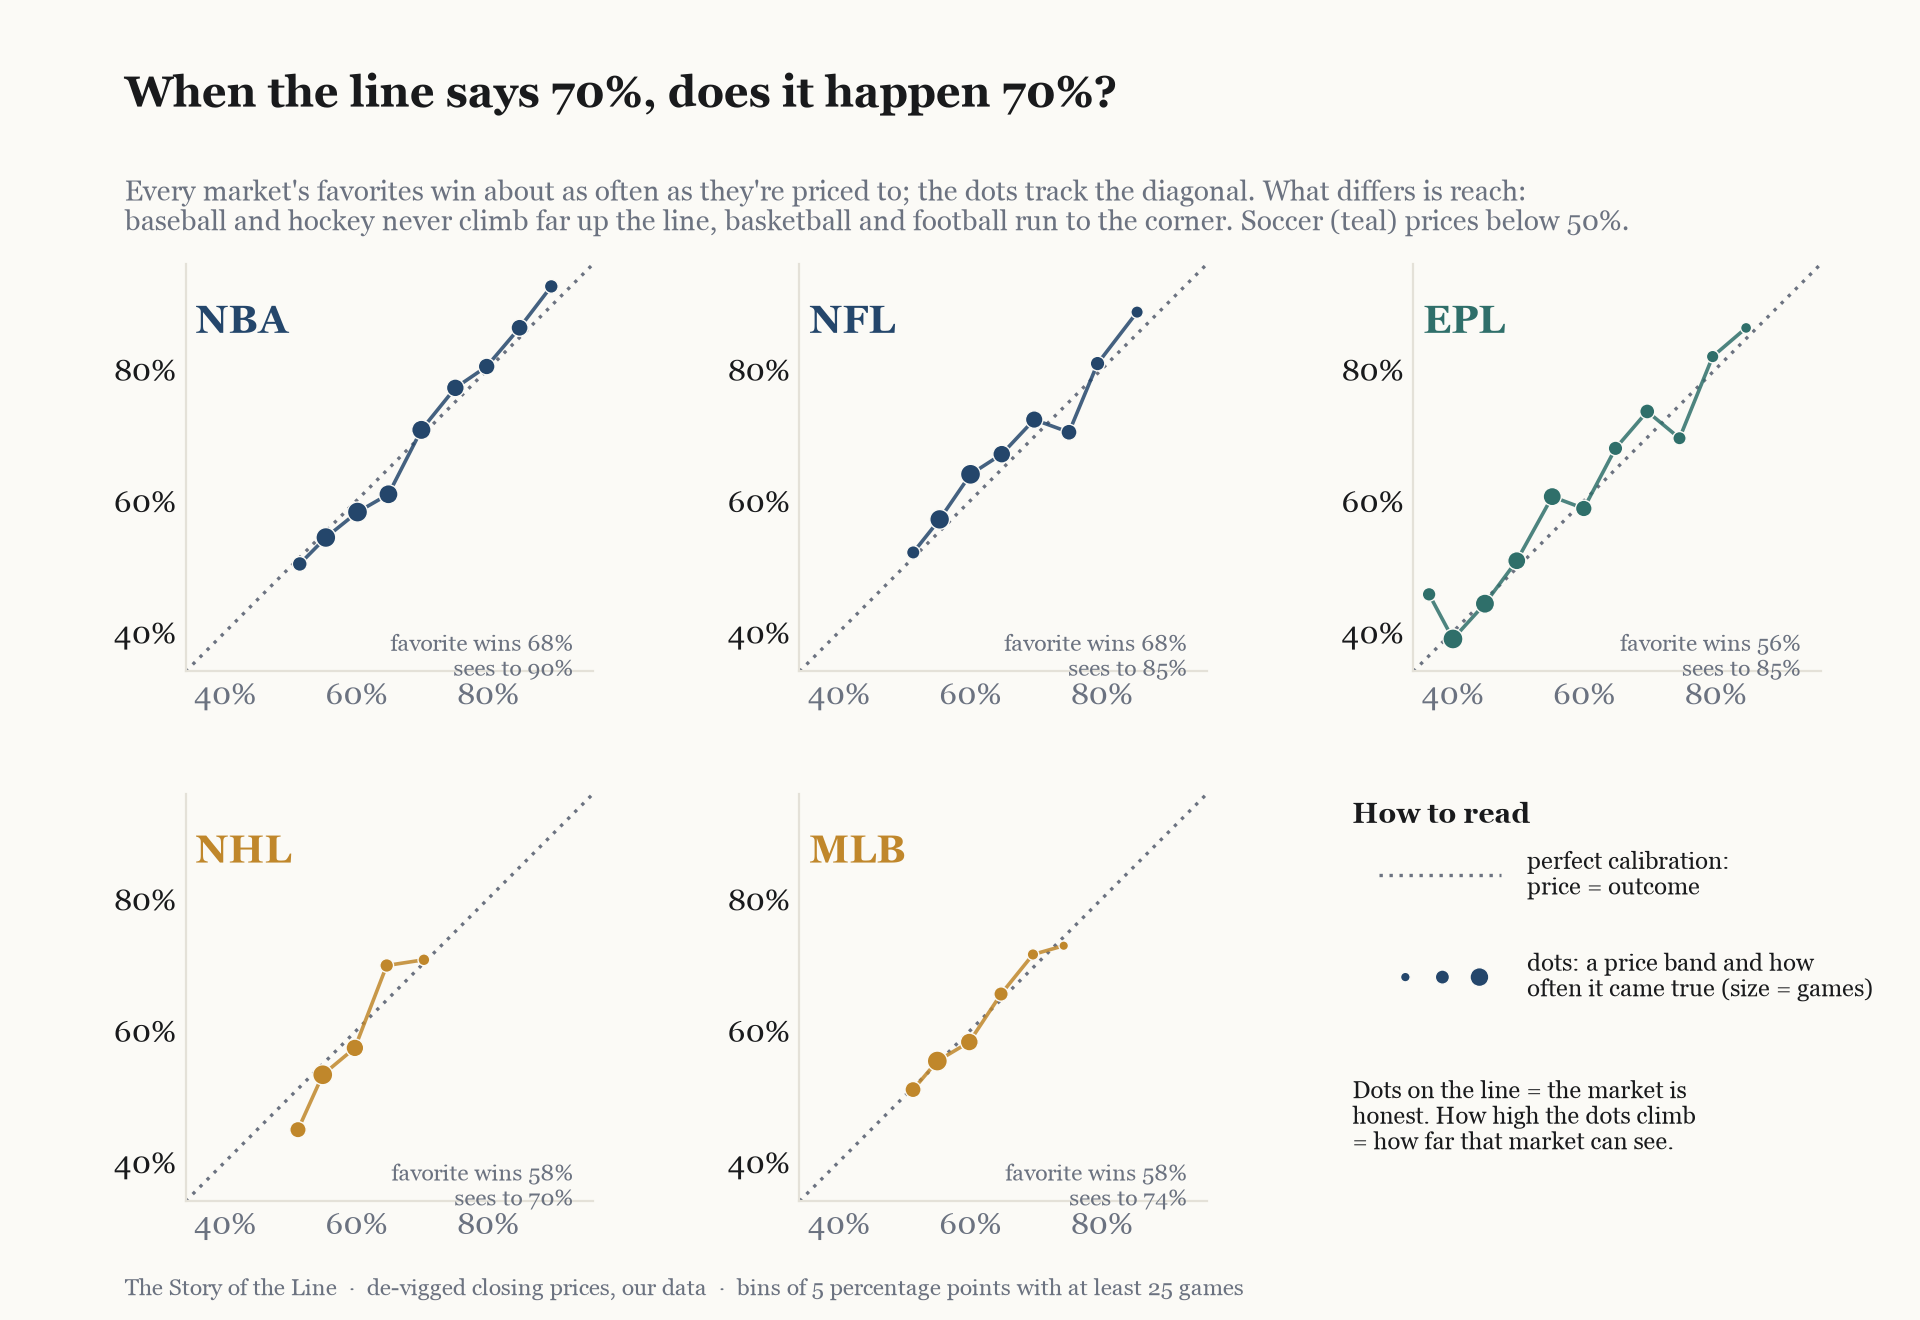
Skill is one thing, honesty is another. A forecast can be sharp and still mislead you, saying 70 when the truth is 55, and you would only find out after a long and expensive season. So we ran the other test. Take every game the market priced the favorite near 70 percent, set them aside, and count how often that favorite actually won.
It won about 70 percent of the time. Do the same across every price and every sport, and the buckets land where they were priced, strung right along the line of perfect calibration, in baseball as faithfully as in basketball. Even soccer, three-way and draw-ridden, stays on the line. The market is not only as sharp as each sport allows, it is honest about how sharp that is, and that is the quiet reason the line is so hard to beat: a market that is not fooling itself leaves you very little to take.
The two leagues with no betting line
Two of our own leagues, the WNBA and the NWSL, do not have a long betting-odds history in our data, so they cannot appear on the charts above, which are all built from what the market priced. But it turns out you do not need a market. You can measure how predictable a league is from game results alone, and the trick is the same one the academics use: look at how spread out the teams are.
If every team were identical and every game a coin flip, the standings would still not come out flat, because luck alone scatters records around .500 by a known amount. So you take the actual spread of team records, subtract off exactly how much a season of pure coin flips would have produced, and what is left over is real: the true gap in team strength. A wide gap means the better team usually wins and the league is predictable. A narrow one means the talent is bunched and anyone can beat anyone.
The reason to trust this is that we can check it. For the four leagues where we have both odds and results, the results-only estimate lands within two points of the market's favorite-win rate every single time: baseball and hockey near 58, basketball and football near 66, matching the market charts almost exactly. A method that reproduces the betting market on the leagues we can see is a method worth believing on the leagues we cannot.
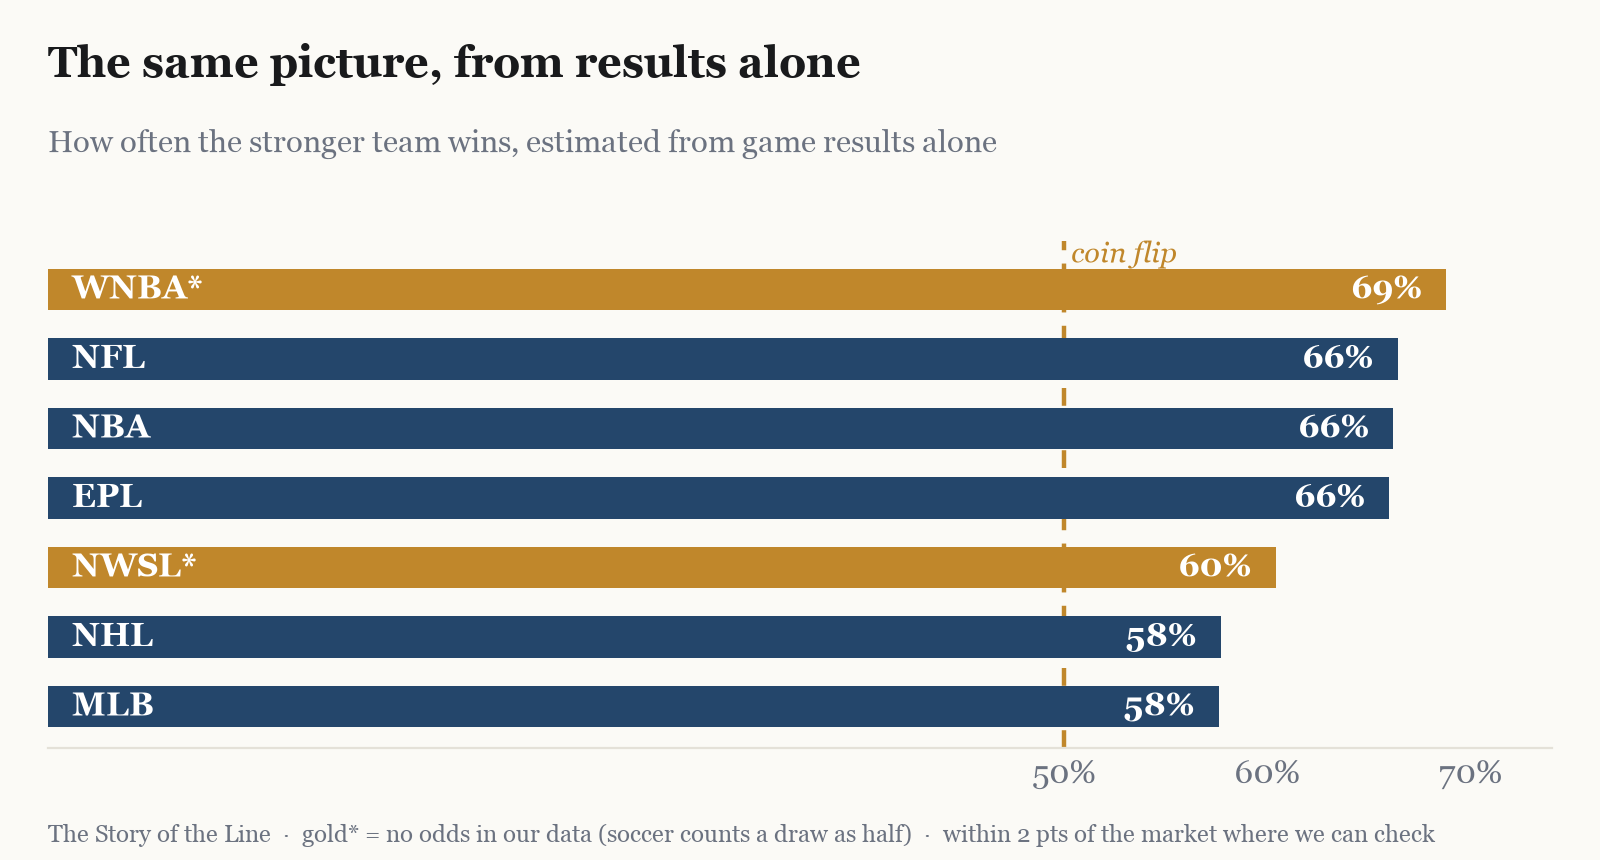
So here are the leagues that were missing, and one of them reframes the whole soccer story. The WNBA is not merely chalk, it is the most predictable league in the entire study: the stronger team wins about 69 percent of the time, a hair clear of even the NBA. A small league with concentrated talent and a few genuine dynasties leaves very little room for a surprise.
Then the twist. The men's Premier League, the sport we spent the first half of this piece calling chaos, has a talent gap as wide as the NBA's, its stronger side taking 66 percent in win-equivalent terms once you count a draw as half. That is not a contradiction, it is the draw doing a magic trick. The English top flight is one of the most top-heavy leagues in the world, a handful of clubs with the money to buy the title and a dozen who cannot, so the pecking order is nearly fixed and the big teams almost never actually lose. They just draw, over and over, because one goal decides a low-scoring game and a lesser side can sit deep and steal a point. So the standings are rigidly predictable while any given Saturday is a coin flip, which is how soccer manages to feel like anarchy and behave like a monarchy at the same time. And our own NWSL, at 60 percent, is the most balanced of the soccer leagues we measured, a genuinely more competitive division than the men's game it gets compared to. Every league landed where the physics said it would, but with the numbers attached now instead of assumed.
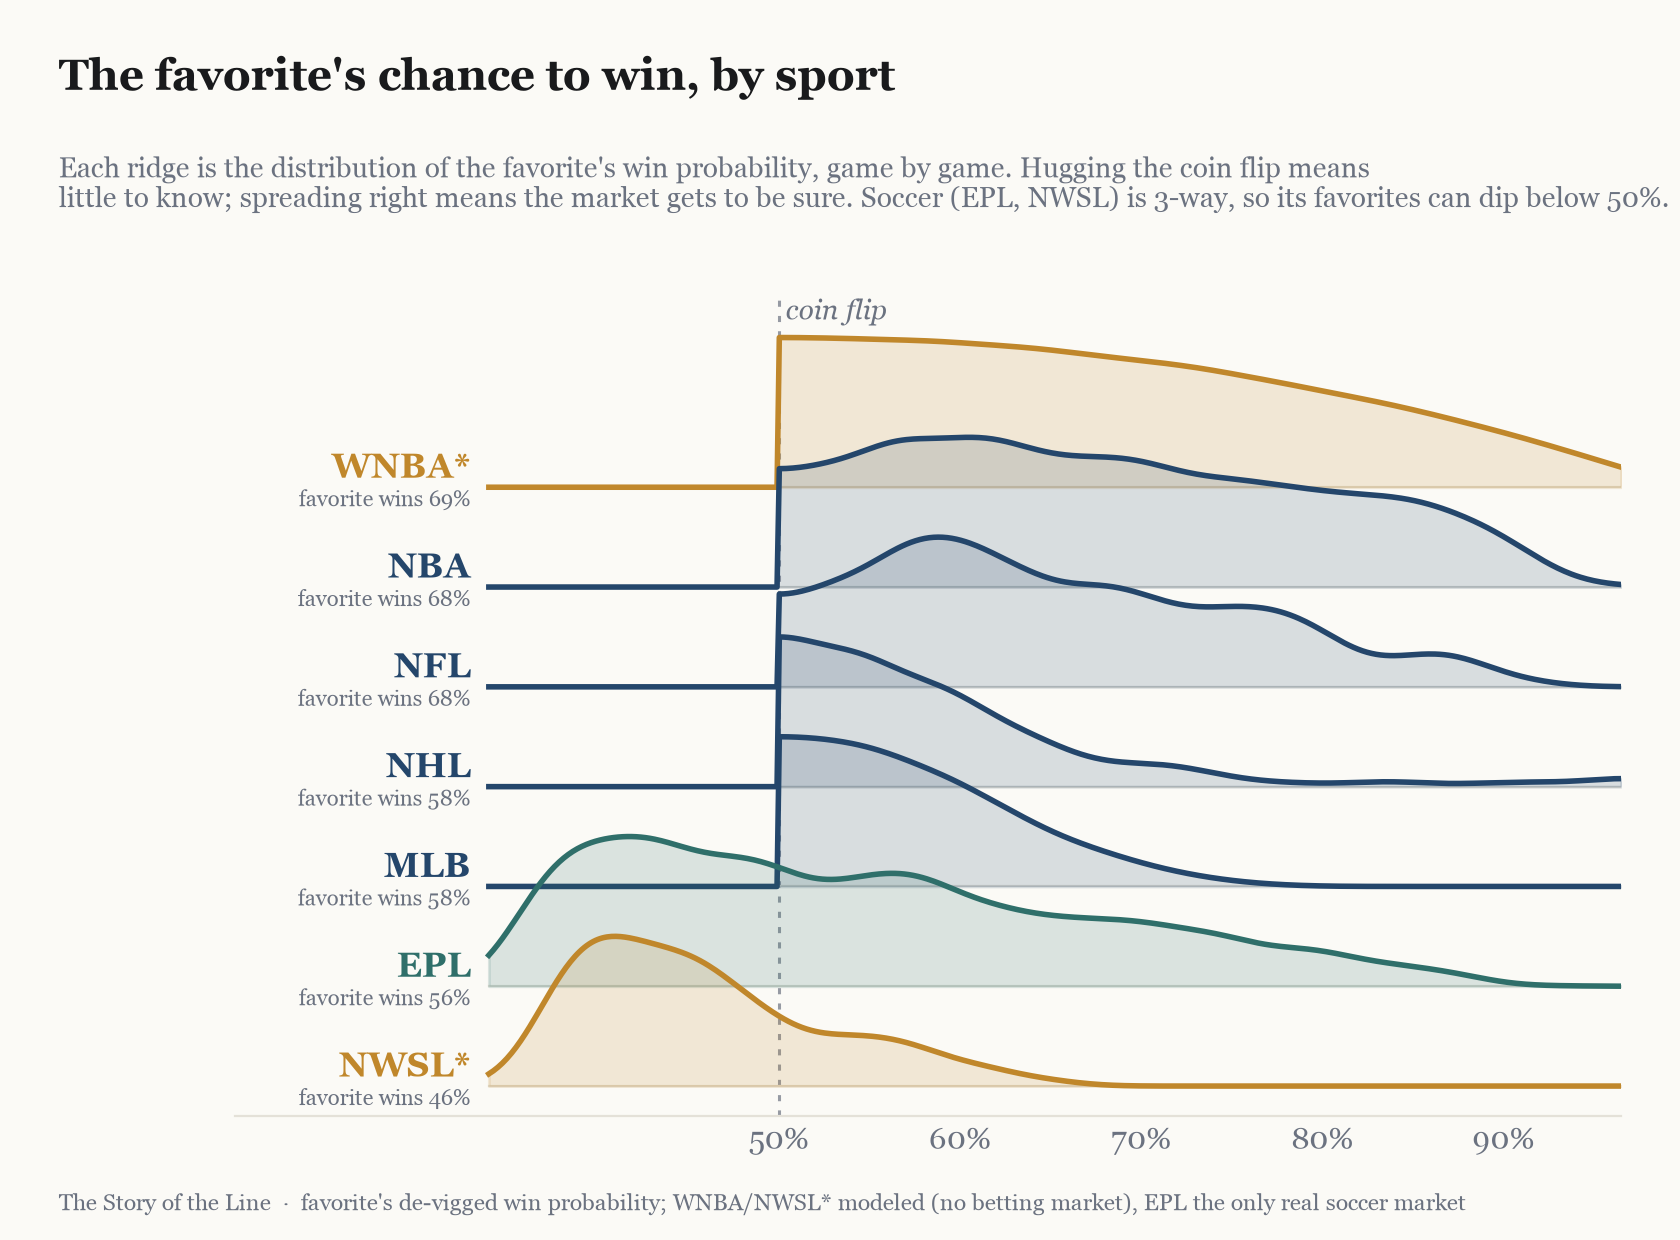
One picture holds the whole spectrum. Instead of a single favorite-win number per league, here is the full distribution, game by game: how likely the favorite was to win, as the market saw it, or as our model did for the two leagues without a market. The shape carries the story. Basketball and football push their favorites far to the right, out toward near-certainty; baseball and hockey pile up against the coin flip and never travel far from it; and the two soccer leagues lean the other way, their favorites so often pinned under 50 percent by the ever-present draw that the curves spill left of a line no other sport crosses.
Why the spectrum exists at all
One idea explains the whole picture, and it is worth remembering the next time a 40-point favorite gets bounced.
Predictability tracks how many things have to go right. The more scoring events decide a game, the less any single fluke can swing it, and the more reliably the better team comes out ahead. Basketball is a hundred possessions and two hundred points; over that many repetitions the better team surfaces, the way a loaded die still looks loaded if you roll it enough. Soccer and hockey are the opposite, two or three goals settling ninety minutes or sixty, so two or three moments of luck settle the season's story, and the better team goes home stunned more often than it should.
Baseball is the strange one, and the reason it sits alone at the bottom is worth naming. It has plenty of events, nine innings and a stack of at-bats, but it funnels almost all of them through a single bottleneck: the man on the mound. One pitcher having his afternoon can erase an entire lineup of All-Stars, so baseball has the raw volume of an orderly sport and the variance of a coin flip anyway. That is why it embarrasses every forecaster, ours included. There is simply less to know.
Others have looked at this, and found the same thing
We did not set out to reproduce anyone, which makes it worth saying that the split we just used, real talent spread against coin-flip luck, is the exact machinery of the academic work, and our numbers land almost exactly where theirs do. The definitive study is Lopez, Matthews, and Baumer's 2018 paper in the Annals of Applied Statistics, which fit Bayesian models to a decade of betting-market data across the four North American leagues and asked how much of a result is skill and how much is luck. Their ranking is ours. The NBA shows the largest spread in team talent and the strongest home advantage; the NHL and MLB stand out for how much of a game is simply random. Season to season, the standings revert toward the mean most in hockey and least in football, which is a formal way of saying hockey teams are the hardest to tell apart and football teams the easiest. Years earlier, Ben-Naim and colleagues measured the same thing from the other direction, counting how often the weaker team wins outright, and put soccer and baseball at the top of the upset table with basketball and football at the bottom. Different methods, different decades, the same order every time. When a rating built on results, a betting market built on money, and a stack of academic models built on neither all point the same way, the thing they are pointing at is almost certainly real.
The concept, named
For the analysts in the room, here is the lesson to carry out of this. Predictability has two definitions and they do not always agree. One is how often the better side wins, and it rewards a big talent gap and a lot of repetitions. The other is how far the best available forecast can see past a blind guess, and it rewards a sport whose uncertainty is structured enough to price. Basketball scores well on both. Baseball fails both. Soccer splits the difference, chaotic by the first measure and surprisingly legible by the second. Whenever someone hands you a forecast, ask which kind of predictable they are selling, because a model can look brilliant on one definition while adding nothing on the other.
The deeper idea underneath is the one every honest forecaster eventually makes peace with: every outcome is part signal and part noise, and the noise floor is set by the sport, not by the model. No amount of data drops baseball to basketball's predictability, because the randomness is real, baked into nine innings and one pitcher and a game of inches. Knowing where that floor sits is not defeatism. It is the difference between a forecaster who promises you certainty and one you can actually trust.
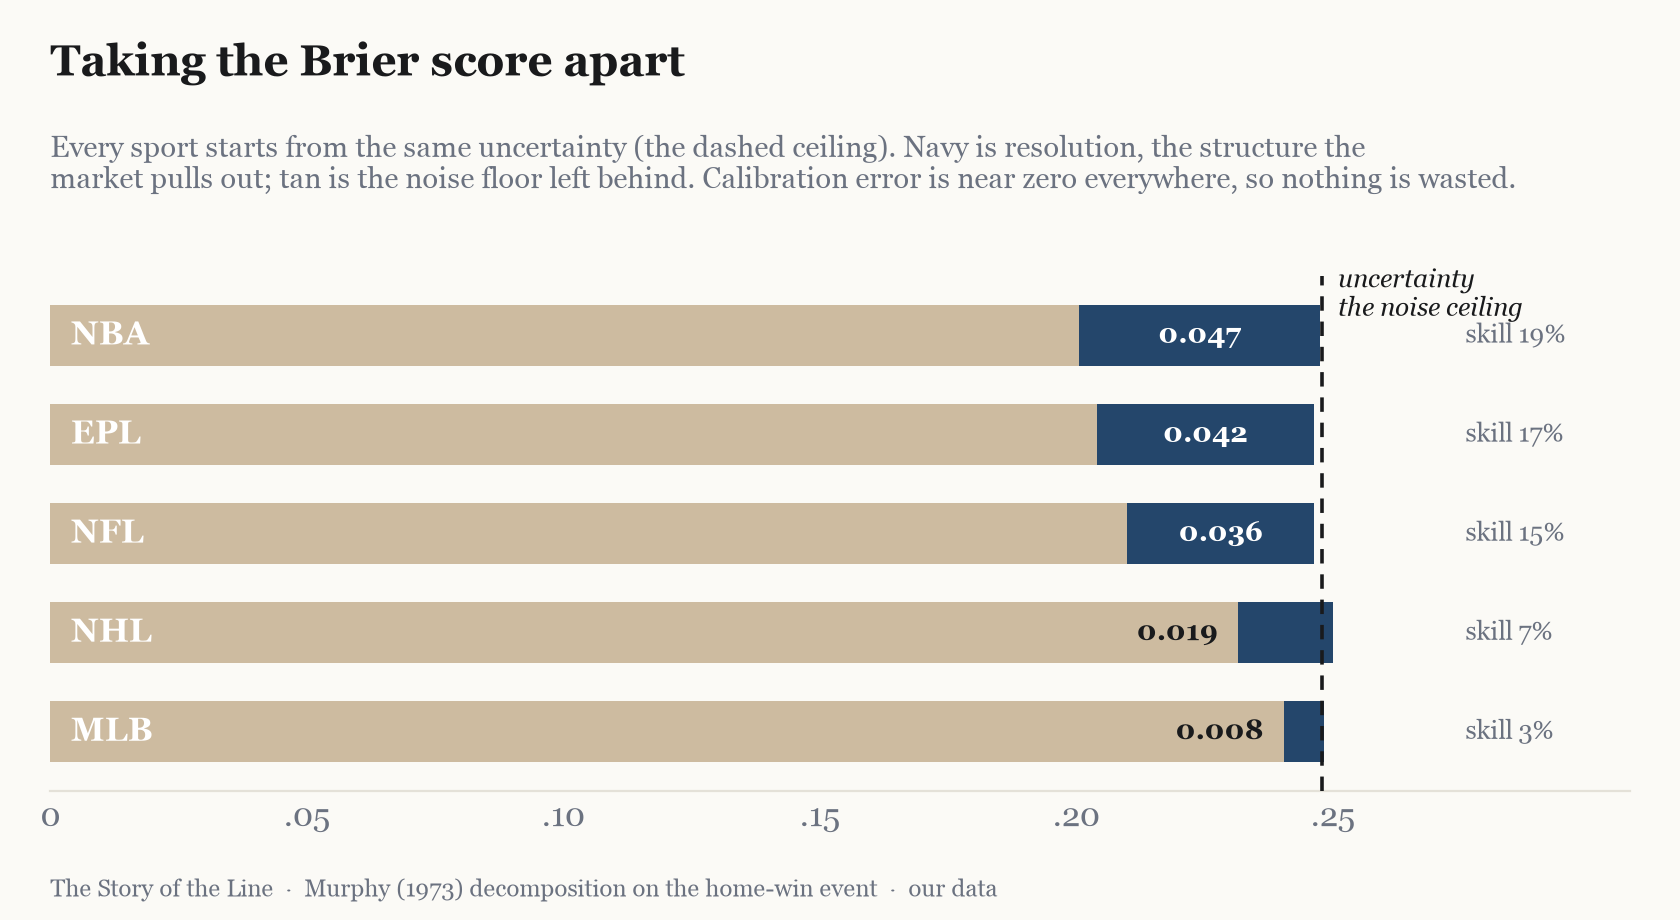
There is a single piece of accounting that holds all of this at once, for the analysts still reading. Any forecast's Brier score splits into exactly three parts (Murphy, 1973): the sport's raw uncertainty, minus the forecaster's resolution, plus its reliability. Uncertainty is the noise floor we just named, the variance baked into the outcome before anyone forecasts a thing, and it is nearly the same coin-flip ceiling in every sport. Reliability is calibration, the distance of those dots from the diagonal, and for the closing market it sits close to zero everywhere: the line does not fool itself. That leaves resolution, the forecast's power to tell one game from the next, and it turns out to be the entire gap between sports. Baseball resolves almost none of its uncertainty, basketball six times as much, and the predictability ranking of this whole piece is, to the decimal, that one column.
What this means if you are keeping score
None of this makes one sport better than another. It makes them different problems, and it means beating the line is a different achievement in each. In basketball, where the favorite really does win two nights in three, the market is nearly unbeatable, because there is so little daylight between what everyone knows and what happens. In baseball, beating the line means being a hair sharper than a process already sitting on the noise floor, and being honest that most nights you will not be. The same forecaster can look like a genius in one sport and a fool in the next, and usually the sport did most of the work.
That is the whole reason we grade every forecaster against the line, sport by sport, out in the open, even on the days we lose. The line is the hardest thing to beat, and it is a different kind of hard in each sport. Watching who clears it, and where, and how often, is the story we are here to tell. So far baseball has told us the most, and what it keeps saying is the one thing every good forecaster already knows: stay humble.
Data note: the favorite-win and market-skill figures for MLB, NBA, NFL, and NHL are computed from our own closing odds joined to final results (13,183 baseball games, 3,976 basketball, 1,136 football across four seasons, 670 hockey); the soccer skill figure is our Dixon-Coles corpus scored against Bet365's three-way closing prices (3,375 Premier League matches). The results-only estimates (the third chart for all seven leagues, and the only source for the WNBA and NWSL, which have no odds history in our data) come from the spread of team records net of coin-flip luck: WNBA from five seasons of Basketball-Reference results (1,174 games), NWSL from six seasons of ESPN results (906 games, 2021-26), EPL from five seasons of football-data.co.uk results (1,900 games). For soccer a draw counts as half a win, so the results-only figure measures talent separation rather than the literal outright-win rate. Academic anchors: Lopez, Matthews and Baumer, "How often does the best team win? A unified approach to understanding randomness in North American sport" (Annals of Applied Statistics, 2018); Ben-Naim, Vazquez and Redner, "Parity and predictability of competitions" (Journal of Quantitative Analysis in Sports, 2006); Murphy, "A new vector partition of the probability score" (Journal of Applied Meteorology, 1973). The Brier decomposition is computed on the home-win event, whose two-way score matches the market-skill figures above; reliability and resolution use ten probability bins.